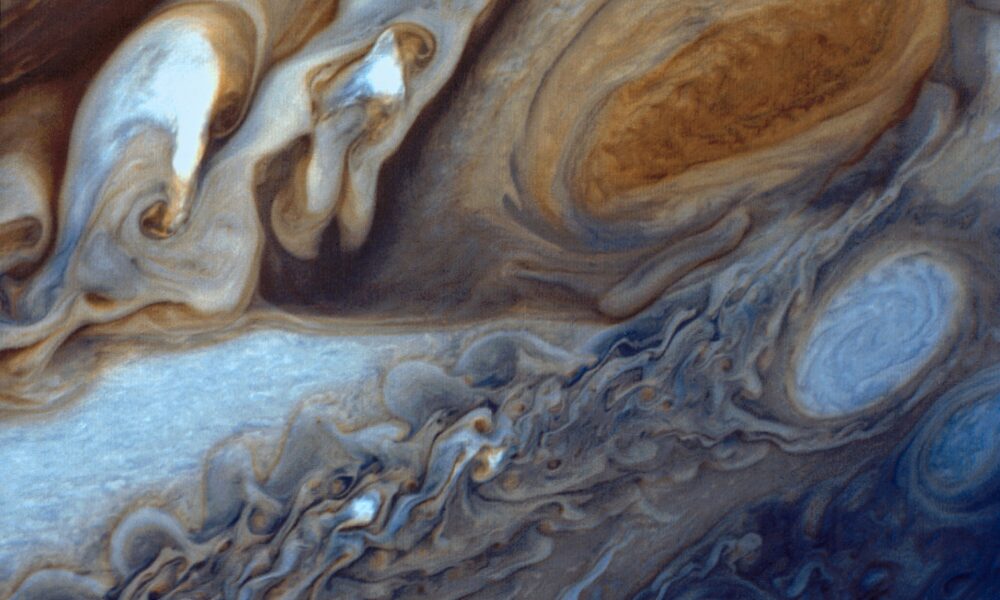

Jupiter’s Great Red Spot is a giant, long-lived anticyclonic storm in the planet’s southern hemisphere. It is not a solid feature on Jupiter’s surface or a hole in the atmosphere. Instead, it is a rotating weather system within the gas giant’s clouds, held in a band of strong winds. NASA’s Voyager spacecraft photographed its swirling cloud structure in 1979; Juno later measured a storm extending roughly 300 miles (500 kilometers) beneath the visible cloud tops. Hubble observations have also shown that its outline changes rather than maintaining one fixed oval shape.
If you’re wondering what causes the red color, how big the storm is, whether it is shrinking, and what scientists know in 2026, the most important distinction is between observations and hypotheses. The storm is unquestionably real and has been watched for centuries, but the full origin of its red pigments and the detailed process maintaining its longevity remain active scientific questions. The actual spacecraft photographs below are NASA/JPL images, not illustrations or generative AI.

What exactly is the Great Red Spot?
The Great Red Spot is a high-pressure anticyclonic vortex embedded in Jupiter’s turbulent atmosphere. Jupiter has no Earth-like solid surface beneath its cloud decks, so calling the spot a “landmark” can be misleading. It exists as a weather feature, with clouds circulating in broad spiral patterns. Its surrounding jet streams help keep it in a relatively stable southern latitude, even while its shape, color and size vary.
The Great Red Spot sits amid the light and dark bands that make Jupiter recognizable in telescope images. Those bands are atmospheric zones and belts shaped by circulation and powerful east–west winds. The red spot’s own motion interacts with surrounding flows, eddies and smaller storms. NASA’s Jupiter overview introduces the broader planet, while the 2024 Hubble study documents observed changes in the vortex.
How big is Jupiter’s Great Red Spot?
There is no single timeless diameter, because the storm changes size and shape and measurements depend on the observation date. NASA reported that the spot was about 11,130 miles wide in a 2009 observation and that its dimensions were declining at the time of a 2014 study. The famous old claim that multiple Earths could fit across the spot referred to its larger historical dimensions, not necessarily today’s size.
One NASA Voyager 1 image taken in early March 1979 shows a field of view approximately 15,000 miles (24,000 km) from top to bottom; that number describes the photographed frame, not an automatically valid modern storm diameter. Similarly, a 1996 Galileo mosaic described a 20,000-km long vortex at that date. To make an accurate modern comparison, use a size estimate tied to the observation year rather than repeating “three Earths wide” indefinitely.
| Observation | What it established | Important limitation |
|---|---|---|
| Historic ground-based observations | A long-lived red oval that persisted across many generations of telescopes | Old descriptions lack modern spacecraft resolution |
| Voyager 1, 1979 | Detailed red cloud bands, adjacent eddies and a rotating vortex | Image size is not the current 2026 diameter |
| Hubble, 2009–2014 studies | Evidence of a long-term change in horizontal size | Values belong to the specified measurement years |
| Juno, reported 2021 | Evidence the storm extends around 500 km beneath cloud tops | That is a depth estimate, not its horizontal width |
| Hubble, December 2023–March 2024 | A roughly 90-day cycle of shape and brightness changes | The cause of the oscillation remains unknown |
Why is the Great Red Spot red?
The storm’s reddish appearance is a property of its clouds and atmospheric chemistry, but there is no universally established single compound that explains every shade seen in telescope images. Scientists investigate how sunlight, ultraviolet radiation and chemicals in Jupiter’s atmosphere may produce colored compounds. The exact cloud composition, altitude, mixing and illumination can all affect how the spot looks.
It is therefore incorrect to claim confidently that the storm is red because it contains an earthly red dye or simply “because it is hot.” The color does not make it a patch of solid land. The surrounding bands often look white, cream, rust or orange; color differences can reveal processes occurring at different heights and in distinct atmospheric regions. Also, spacecraft color photographs may combine separate observations through filters, as NASA openly explains for its Voyager images.
Does the Great Red Spot spin clockwise or counterclockwise?
In conventional images viewed from above Jupiter’s north pole, the Great Red Spot circulates counterclockwise, the anticyclonic direction in Jupiter’s southern hemisphere. This is the opposite of how many viewers instinctively imagine hurricanes in Earth’s Northern Hemisphere. Comparing planetary storms solely by their rotation direction can be confusing because the hemisphere and atmospheric physics both matter.
NASA’s Voyager 1 Great Red Spot mosaic records how researchers tracked clouds around the storm. At the 1979 encounter, clouds circling the spot were seen to travel around it over several days; that does not mean the entire planet rotates once in that interval. Jupiter itself turns far faster, completing a planetary rotation in roughly ten hours.
What NASA’s Voyager 1 photographs actually show
NASA’s Voyager 1 flyby in 1979 transformed the Great Red Spot from a distant telescope feature into a richly structured atmospheric scene. The photographs show folded cloud bands, nearby white ovals and complex flows on the storm’s edges. Voyager 1’s sharp views also let researchers see smaller weather features too subtle to resolve clearly from Earth.
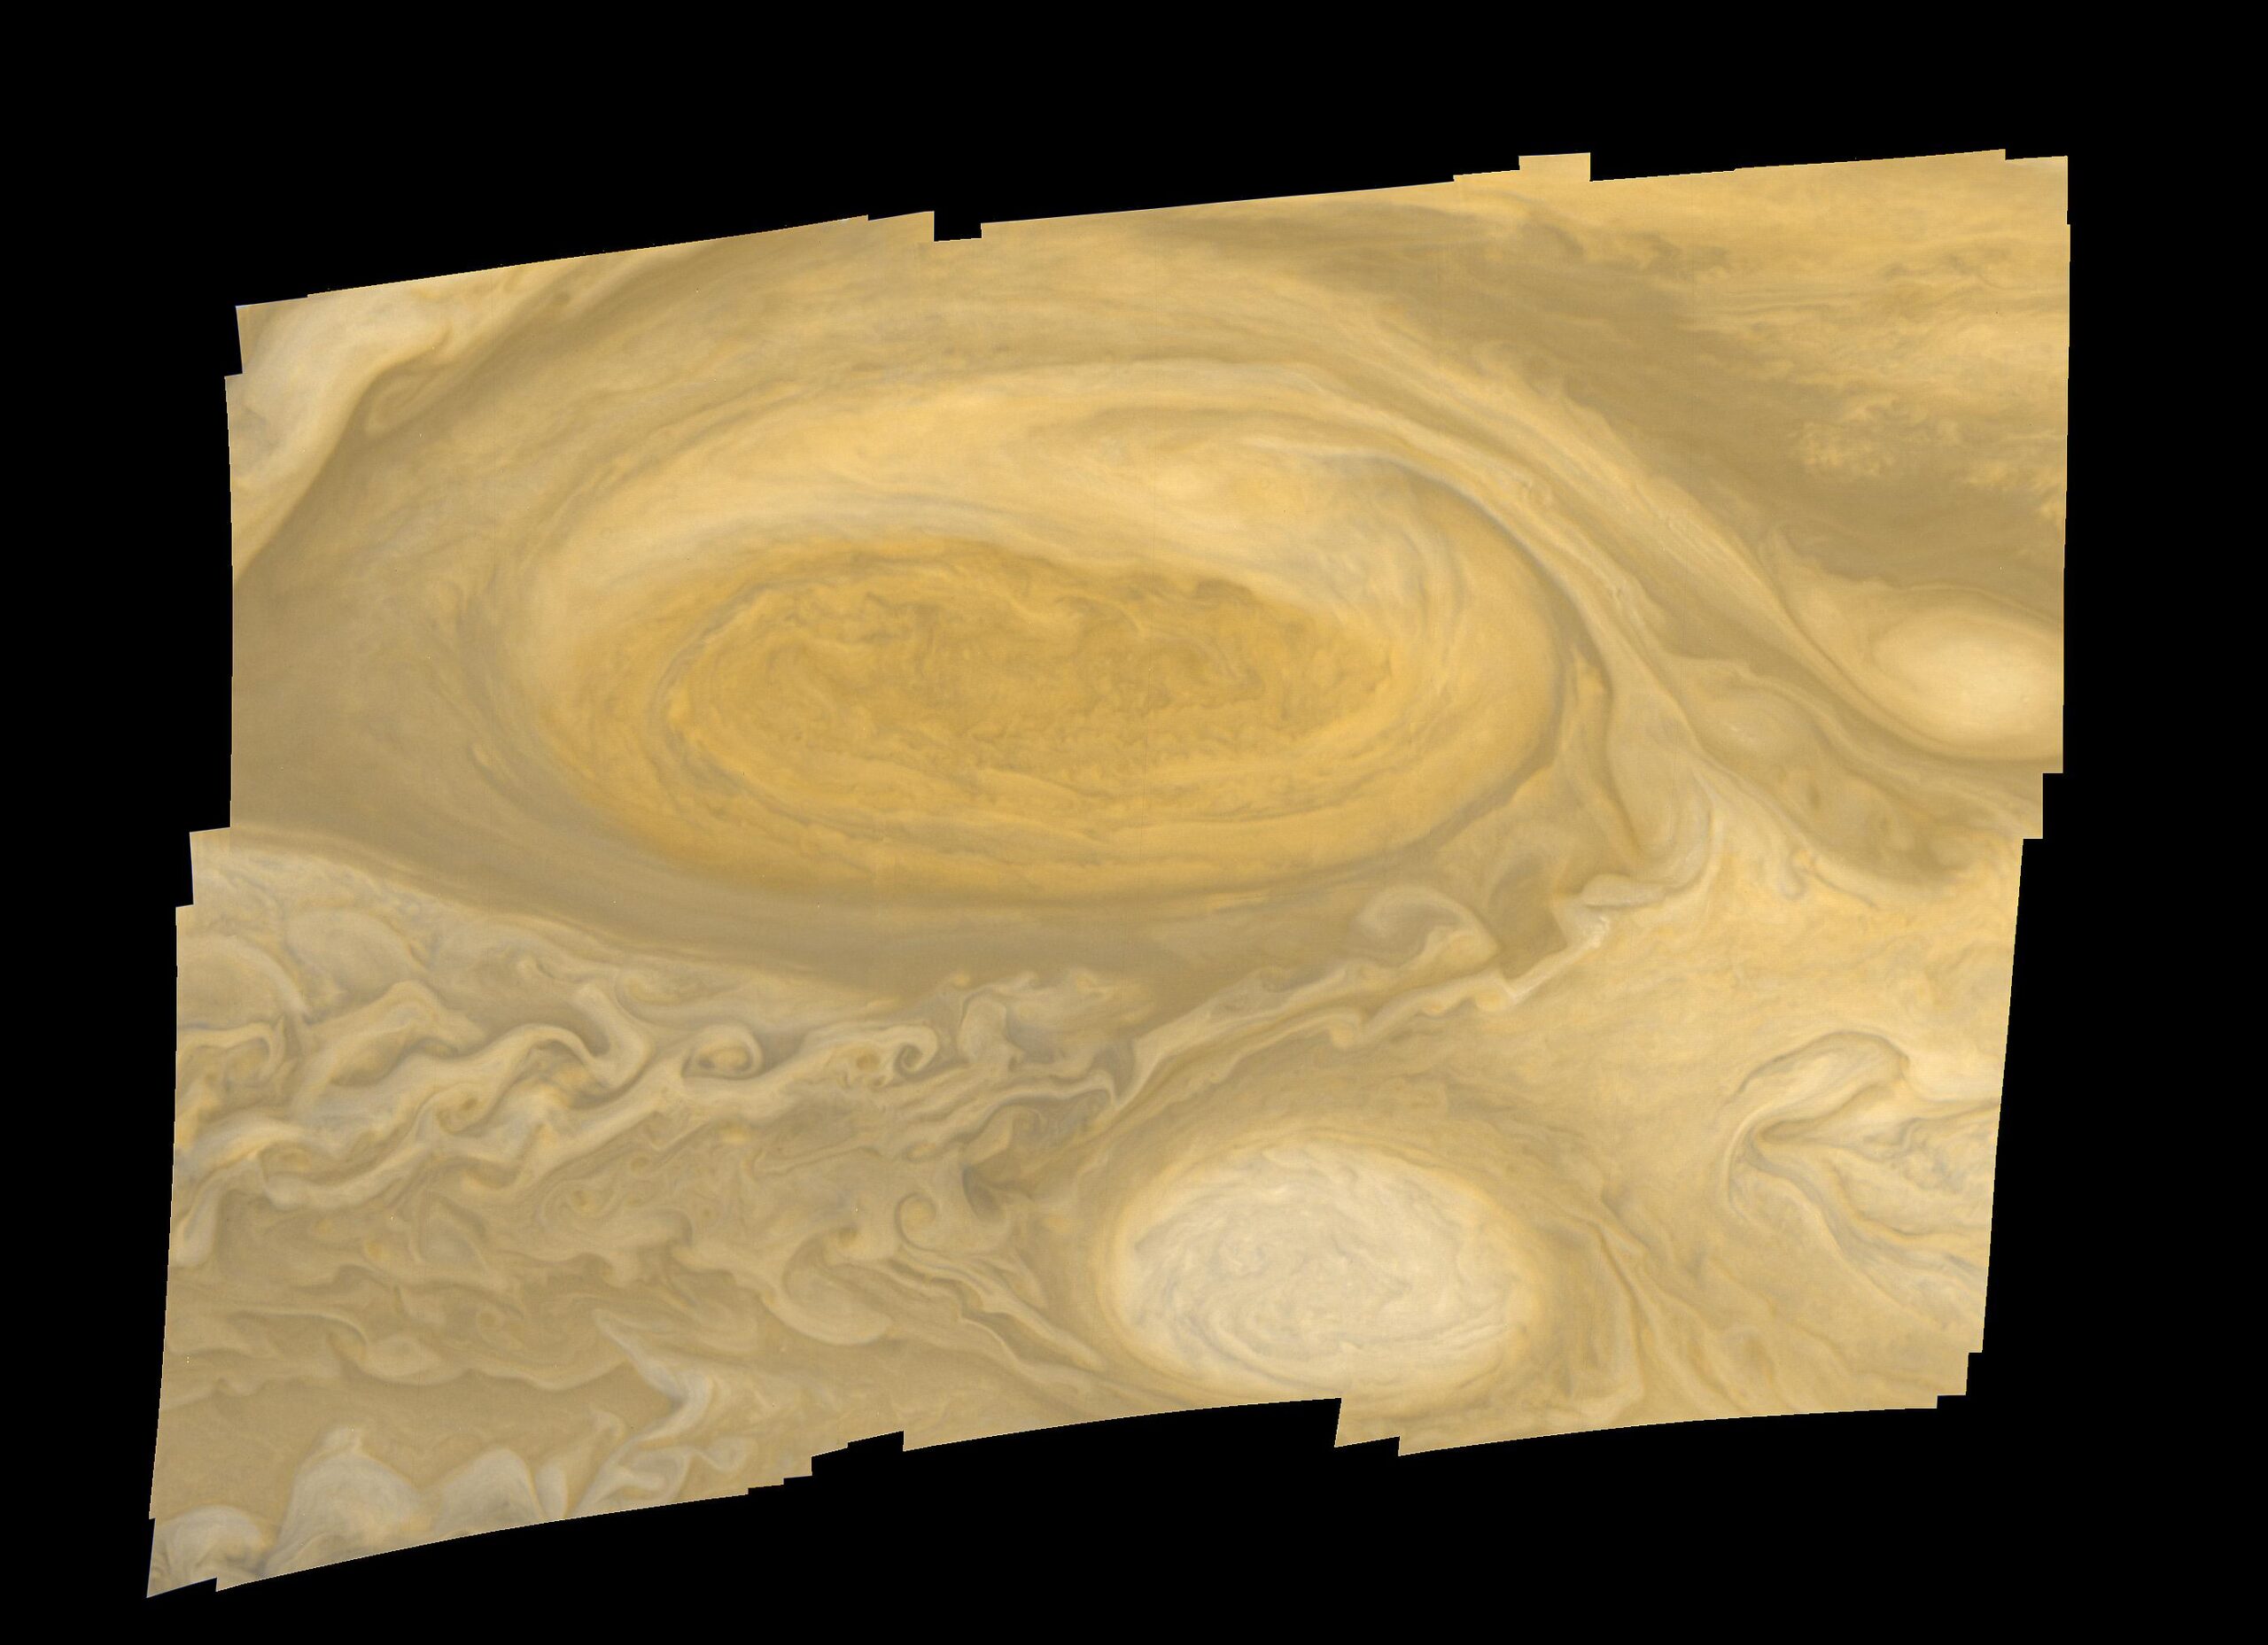
The first photograph here is an original NASA/JPL Voyager 1 color composite, PIA01384. NASA says separate black-and-white filter exposures were reconstructed into a color image. The second is the Voyager 1 mosaic PIA00022, which captured the storm and nearby white ovals in early March 1979. In other words, these are authentic mission images, but their processing and historical dates matter when interpreting them. They are not live views of Jupiter today.
How deep is the Great Red Spot?
NASA’s Juno mission results report that the famous vortex reaches approximately 300 miles (500 km) into Jupiter’s atmosphere below the clouds. This was surprising because cloud-top images alone cannot tell researchers precisely how far atmospheric circulation extends downward.
Juno has provided measurements of Jupiter’s gravity field and its atmosphere, improving our understanding of large storms beyond what a camera reveals. The 500-km figure is an estimate based on the mission’s scientific analysis, not a visibly marked boundary in the Voyager photographs. If you want a wider view of how the spacecraft studied Jupiter, our Juno spacecraft guide covers its instruments and orbit.
Is Jupiter’s Great Red Spot shrinking or disappearing?
NASA has documented a long-term reduction in the storm’s width over multiple observational eras. In a 2014 NASA analysis, researchers discussed a notable acceleration in apparent shrinkage beginning around 2012 and considered whether nearby eddies could alter the storm’s momentum. That analysis did not prove the vortex would vanish on a predictable date.
More recent Hubble observations show that width is only part of the story. Measurements from December 2023 to March 2024 found a repeating cycle in the spot’s elliptical shape, brightness and twisting. A storm can stretch, squeeze, change intensity and interact with neighboring clouds while still persisting. Headlines that equate one year’s shrinking width with imminent disappearance overstate the evidence.
Why did Hubble scientists compare it to a stress ball?
The comparison came from a 2024 NASA Hubble analysis of Jupiter over approximately 90 days. Instead of behaving as a perfectly steady oval, the Great Red Spot appeared to squeeze and relax, oscillating in shape. The research team studied its location, brightness, color, twisting and overall form through a repeated observation sequence.
NASA describes the spot as being confined between atmospheric jet streams, which help anchor its latitude. The team did not identify a definitive explanation for the observed 90-day oscillation. It is important to distinguish an observed periodic shape change from a fully understood physical mechanism.
How do Jupiter’s storms compare with Earth’s hurricanes?
| Feature | Great Red Spot | Typical Earth hurricane |
|---|---|---|
| Planet | Jupiter, a gas giant | Earth |
| Location | Southern atmospheric bands | Often over tropical oceans |
| Longevity | Observed over centuries | Usually days to weeks |
| Solid surface beneath | No Earth-like solid surface beneath the visible clouds | Moves above ocean and sometimes land |
| Storm character | Long-lived high-pressure anticyclone | Low-pressure tropical cyclone |
Both feature powerful moving clouds, but they are not simply different-sized versions of the same weather system. Their energy environments, atmospheric structure and boundary conditions differ greatly. The comparison is useful for imagining a large vortex, not for importing every rule of terrestrial hurricane behavior into Jupiter.
Can you see the Great Red Spot through a telescope?
Yes. Under favorable observing conditions, experienced amateur astronomers can make out the spot using appropriate telescopes and magnification. The view is far subtler than the saturated spacecraft images commonly shown online: contrast, atmospheric seeing, Jupiter’s position and the storm’s rotational longitude all influence visibility. Jupiter’s rapid spin means the Red Spot is not facing Earth at every moment.
Plan to observe Jupiter when it is relatively high above the horizon and check a reliable planetarium or astronomy tool for the predicted central-meridian crossing of the Great Red Spot. Give your telescope time to reach ambient temperature and avoid expecting Voyager-level colors from a small visual instrument.
Jupiter’s Great Red Spot FAQ
Is the Great Red Spot bigger than Earth?
It has been large enough to exceed Earth’s diameter in observations, but its dimensions evolve. Do not apply a historic Voyager-era statement about how many Earths fit inside it to the present without a measurement date.
Is Jupiter’s red spot an actual storm?
Yes. It is a long-lasting anticyclonic vortex in Jupiter’s atmosphere, not a volcano, crater, solid object or opening in the planet.
How old is the Great Red Spot?
A giant red oval has been watched by astronomers for generations, and the modern Great Red Spot is commonly described as centuries old. There is uncertainty about whether all early historic sightings refer to exactly the same continuously persisting vortex.
Why does it stay in the same region?
The spot’s circulation is influenced and partially confined by atmospheric jet streams at southern latitudes. That does not mean its longitude or shape never changes.
How far down does the storm go?
Juno data indicate roughly 300 miles (500 km) below the visible cloud tops, much deeper than what can be directly inferred from a photograph.
Do NASA’s 1979 photos show Jupiter as it looks in 2026?
No. They depict a historical encounter. The Great Red Spot continues to change, so observations need dates and clear context.
Will the spot vanish soon?
No specific disappearance date is scientifically established. Long-term shrinking has been measured, but the storm’s future cannot be predicted reliably from a straight-line extrapolation of one measurement period.
NASA photo provenance and sources
The authentic images in this guide are courtesy NASA/JPL: Voyager 1 PIA01384 and PIA00022, both historical spacecraft observations. This editorial reuse follows NASA’s media usage guidelines and does not imply NASA endorsement. Explanations of recent science draw from Juno’s storm-depth results, NASA’s 2024 Hubble analysis, and NASA’s earlier shrinkage measurements.
Bottom line: the Great Red Spot is an actual, vast and evolving storm. Voyager established its striking cloud structure, Juno investigated its remarkable depth, and Hubble showed that its shape changes in complex ways. The most reliable way to understand it in 2026 is to connect every measurement and image to its date instead of treating historic photos as a live update.